Thursday 27 April 2023

Food for Thought or Just One PAT Question Analysed

After publishing my post about PATs areas that we test on without teaching, I recalled and decided to share a story about my last year Y4 student who scored Stanine 9 in PAT but struggled with one particular question - "Visualise which shape a net will fold to make." 

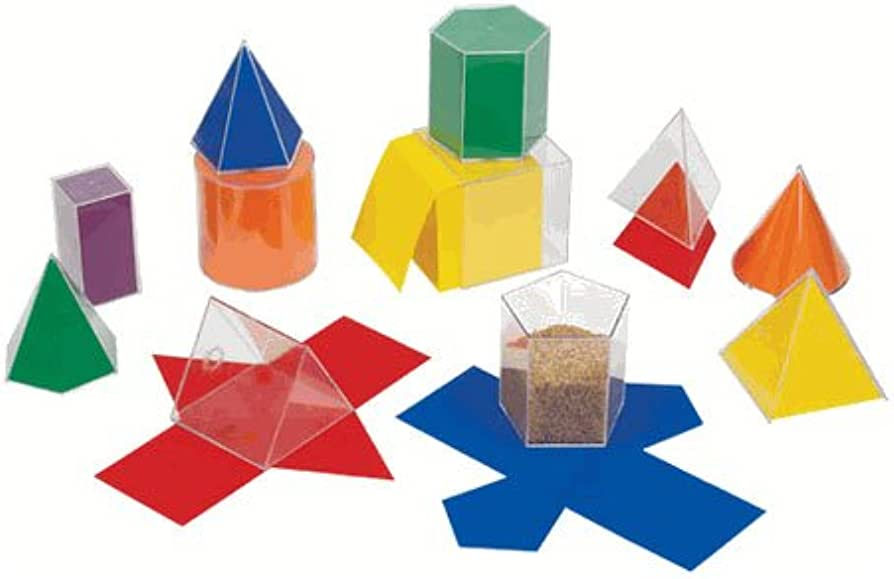
At that time, I was placing an order to buy more maths resources for our school including a set of 3D folding shapes, which we used with our Year 3-4 classes. I wanted to provide our students with a hands-on way to explore and visualize 3D shapes and their nets. Little did I know that this tool would have a significant impact on their learning, even a year after using it. Surely, you can fold 3D shapes using paper, but we had an opportunity to purchase this maths equipment and students loved it!

Out of curiosity, I looked at random Y4 and Y5 classes to find out their answers to this particular PAT question for the past 3 years.

2020 - Term 4


2021 - Term 4

2022 - Term 1

2022 - Term 4 -  our Team excelled in the PAT "visualise a shape" question that had previously stumped many of Year 4 and 5 students.

2023 Term 1 (after the summer break, mostly the same students with some new intakes)

"Visualize which shape a net will fold to make." This question could be challenging for some students because of a specific skill we often do not cover in our maths programme. 

As seen from the examples above, after using the folding shapes in our team, students were able to visualize the 3D shapes and their nets with ease. They were able to apply their knowledge to the PAT assessment and, in Term 4 2022 for the first time in three years, most of Team Kea's students answered the question correctly. Furthermore, the majority of learners retained their knowledge after a summer break (this is not clean data as we have a number of new students from other schools and teams).

This set of data highlights the importance of analyzing assessment data to identify areas where our students need explicit teaching or additional support. 


Wednesday 26 April 2023

Tools, Measures & Approaches

Describe the tools/measures/approaches you plan to use to get a more detailed and accurate profile of students’ learning in relation to that challenge. Justify why you chose these approaches and tools.

Recently, I had the opportunity to analyze PAT assessments from our school and discovered some concerning learning gaps among our students. Many students struggled with questions that were not covered in our classroom maths programmes or were only briefly covered (based on my personal, team and other teachers' reflections)

If students have never been exposed to specific maths concepts or skills, expecting them to answer questions on those topics is not fair. In fact, testing students on material they have not been taught is not only unfair, but it is also not an accurate reflection of their true understanding of the maths curriculum.

The PAT exams are designed to assess a student's understanding of the broader maths curriculum, but this does not mean that students should be expected to answer questions on topics not taught in class. 

I used the 'individual items' report for all our classes and identified similarities in topics that most students struggled with: Statistics, Geometry, Measurements, Fractions and Algebra. Some examples are below:

                                                                    Year 5:                                                                          


Year 8:
Year 4:

On the other hand, I also analysed which areas of Maths we delivered effectively. This is just a great illustration of "what we taught - our students learnt!" We just need to review our maths programme and include the areas that we neglected before.

                                                                     Year 4:                                                                            

Year 5

A hypothesis I developed was that our current maths programme was not adequately covering all the topics included in the PAT assessments. To create a rich picture with a high degree of reliability and specificity, I plan to create an e-asttle test including all the areas tested in PATs. Gloss data also will be used to support Number knowledge and strategies results. 

Along with these 3 tests, I will collect student voice. I already interviewed a few students after their PATs and discovered that many of them experienced frustration due to their lack of knowledge on certain topics. Formative assessment is ongoing.

At the same time, we need to ensure that we're not simply teaching to the test. Our goal should be to provide our students with a well-rounded understanding of the subject. This means incorporating a variety of teaching strategies, including hands-on activities, real-world applications and opportunities for critical thinking and problem-solving. Teaching Measurements, Geometry and Statistics can be part of the integrated curriculum - our LCS pedagogy. 

I shared my findings with my school's teachers and senior team. My purpose was to highlight the importance of using assessment data for planning. 

I will continue with my inquiry about helping teachers understand the value of using assessment data effectively to create a culture of data-driven instruction in my school and hopefully the wider Manaiakalani Kāhui Ako.  I truly believe that this can lead to improved student outcomes and a more effective and meaningful learning experience for both teachers and students.